
Helis Academy Pathway Analysis Practical
Date: 12 June, 2019
Pathway analysis helps you to interpret the data in a biologically meaningful context. We will use the data from the paper “Identification of a novel biomarker, SEMA5A, for non-small cell lung carcinoma in nonsmoking women“ by Lu et al. published in Cancer Epidemiology, Biomarkers & Prevention in 2010 (see paper). You will need the WikiPathways human pathways collection that you can download here as a zip file. You will need to unzip it before use.
Assignment 1: Open a Pathway in PathVisio
Question 1A. Small numbers above data nodes, interactions or the info box in the top left of the pathway indicate publication references. Double click the info box in the top left (Title, Availability, Last modified, Organism) and go to the “Literature” tab. Is there a paper reference for this pathway?
Question 1B. Click on the GSK3B gene in the top left. With which identifier and database is this gene annotated? (Check the “Backpage” tab on the right side). Which cross references do you see?
Load the identifier mapping database:
- Go to Menu Data → Select Gene Database → Browse to Hs_Derby_Ensembl_91.bridge in the Data folder
- Check the status bar at the bottom to see if the gene database has been loaded correctly.
Question 1C. Click on the GSK3B gene again and go to the “Backpage” tab. Can you now also find other identifier(s) for this gene?
(Required for following steps!) Which other databases have additional information about this gene through the cross references provided by BridgeDb?
Assignment 2: Data Import in PathVisio
Question 2A. Open the statistical analysed data in Excel (comp_LungCancer-Normal.txt in Pathway_Analysis_Data folder). The first column contains the identifier of the genes (ENSG_ID). From which of the three database below are the identifiers in the dataset? (Required for following steps!)
- Ensembl
- Entrez Gene
- OMIM
Import the data as described below. Go through the different dialogs and before you click “Finish”, answer the questions at the end!
Steps data import:
- Menu “Data” → Import expression Data
- Select the lung cancer dataset (comp_LungCancer-Normal.txt in the Pathway_Analysis_Data folder) as the input file. Everything else should be filled in automatically (see Figure 2a).
- In the next dialog, make sure the correct separators are used. You should see the different columns in the preview (see Figure 2b).
- Important: in the next step you need to select the column that contains the gene identifier and the database (system code) for the identifier. Select the database you chose in question 2A (Note: if the database is wrong your identifiers will not be recognized correctly), see Figure 2c.
- Now the data is imported (see Figure 2d). Before clicking “Finish” answer the questions 2B and 2C below:
Question 2B. How many rows were successfully imported?
Question 2C. How many identifiers were not recognized? What does that mean? Important: if the number of rows is the same as the number of identifiers not recognized the data import was not done correctly - you probably didn’t select the correct database (step 4 data import)! Redo the import or ask one of the instructors for help. (Required for following steps!)
Check before you continue!
If you clicked finish, you should see a default visualization on the pathway (if all genes are gray, the data import was not successful → please redo the import, make sure you select the correct database in step 4, otherwise ask one of the instructors). Click on the GSK3B gene and check the “Data” tab on the right side → do you see the expression data? ———————————————————————————————————————————–
Assignment 3: Creating a Basic Visualization
Follow the instruction to create a basic visualization:
- Go to Data → Visualization Options
- Create a new visualization named “basic visualization”
- Select “Expression as color” and “Text label”.
- In “Expression as color” select “Basic”.
- Check the checkbox before “logFC” and define a new color set.
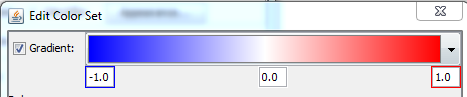
- Select “Gradient” and define a gradient from -1 over 0 to 1 (blue - white - red) → Click OK.
Question 3A. Make a screenshot of the pathway. What do the colors in the pathway mean biologically? (Hint: Check the “Legend” tab on the right side).
Question 3B. Select the ORC6 gene (bottom left), go to the “Data” tab. What is the logFC of the ORC6 gene?
Assignment 4: Create and Advanced Visualization
PathVisio also allows users to visualize multiple data columns together. For that we need to create a new advanced visualization.
- Go to Data → Visualization Options
- Create a new visualization named “advanced visualization”
- Select “Expression as color” and “Text label”.
- In “Expression as color” select “Advanced”.
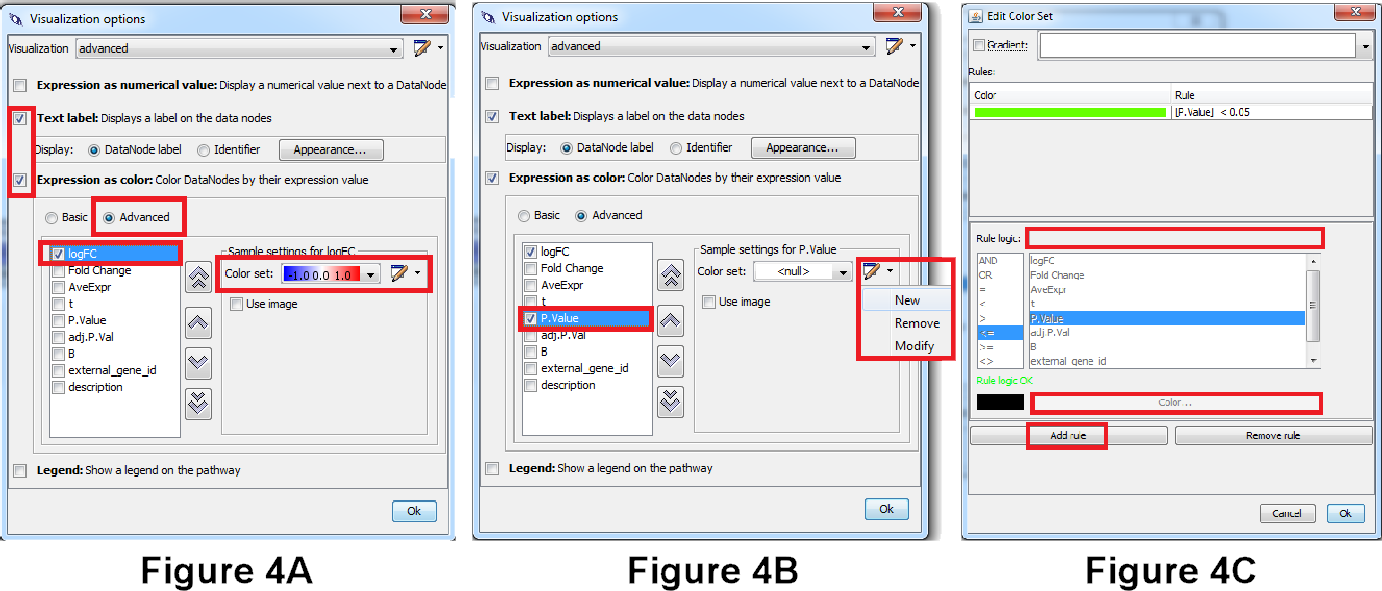
- Check the checkbox before “LogFC” and define a new color set, see Figure 3a.
- Select “Gradient” and define a gradient from -1 to 0 to 1 (blue - white - red) → Click OK (same as in simple visualization).
- Check the checkbox before “P.Value” and define a new color set, see Figure 3b.
- At the bottom, click on “Add Rule”. Go to the text field next to “Rule Logic” and specify the following criteria: [P.Value] < 0.05. Then click on color and select a light green. Click OK and OK, see Figure 3c.
Question 3A. Make a screenshot of the pathway. What do the colors in the different columns on the data nodes in the pathway mean biologically? (Hint: Check the “Legend” tab on the right side).
Question 3B. How many significant genes (P.Value < 0.05) are in the pathway?
Assignment 5: Perform Pathway Statistics
To identify pathways that might be affected by lung cancer, you can perform pathway statistics to calculate Z-Scores for each pathway (check lecture!). PathVisio automatically ranks the pathways based on the Z-Score.
- Go to Menu Data → Statistics
- First we need to define a criteria for differentially expressed genes. We are going to select those genes based on significant p-value but we are also going to make sure the change is high enough by specifying a logFC threshold: a. ([logFC] < -1 OR [logFC] > 1) AND [P.Value] < 0.05
Question 5A. Explain in your own words what this expression criteria means (which genes will be selected)? ([logFC] < -1 OR [logFC] > 1) AND [P.Value] < 0.05
- Now we need to specify the pathway directory. In the Pathway_Analysis_Data folder you can find the directory: Wikipathways-Human-Pathways
- Browse to this directory and select it.
- Then click on Calculate and wait for the result table.
Question 5B. What are the top 5 altered pathways and what are their Z-Scores? Do you see highly ranked pathways in the result table that you expect to be affected by lung cancer? (biological interpretation - link to prior knowledge!)
Question 5C How many genes of the dataset are in at least one pathway (N) and how many differentially expressed genes of the dataset are present in at least one pathway (R)? (Check “N and R” above the result table)
Question 5D What is the pathway with the lowest Z-Score? What does a low Z-Score mean biologically? (ignore pathways with NaN)