
Data Pre-processing Tutorial using ArrayAnalysis
=============================================================================
12 June, 2019
Tutorial prepared by: Dr. Lars Eijssen and Dr. Lauren Dupuis
Introduction
Cancer is characterized by uninhibited cell division that can spread throughout tissue and to other parts of the body. Cancer affects millions of people worldwide. According to cancer.gov, an estimated 38.4% of people will be diagnosed with cancer in some form during their lifetime (https://www.cancer.gov/about-cancer/understanding/statistics). Cancer is a complex disease that is sometimes caused by genetic factors. One way to better understand the underlying genetics of cancer is to study the transcriptome of healthy versus diseased tissue. One example study is that by Lu et al. 2010.Lu et al. 2010 studied the differences between healthy and cancerous lungs in non-smoking Taiwanese females. A sample of normal and a sample of tumor tissue were each extracted from the lungs of 60 females and processed for gene expression profiling. Affymetrix U133plus2.0 expression arrays were used for tissue analysis. The data have been made openly available in the Gene Expression Omnibus (GEO) (https://www.ncbi.nlm.nih.gov/geo/query/acc.cgi?acc=gse19804).
Assignment 1
Before conducting any analysis on data from online repositories, it is important to get a clear insight into the design of the study in which the data was generated. First, open the GEO accession link given above, and answer the following questions:
Question 1A Which specific type of Affymetrix chip was used in this study to measure the gene expression?
Question 1B How many samples were included in the study in total?
Question 1C Based on the list of samples, which are the experimental groups and how many samples are in each of them?
In the following exercise you will perform the quality control of the microarray dataset described above. The aim of this exercise is to get acquainted with the generated images that help you assess the quality of the arrays. In the end, you will be able to answer the question: “Do we have a high quality dataset?” For the purposes of this exercise, we have already reduced the number of samples to 10 each of cancerous and normal tissue. All samples are from different patients. The zip file can be downloaded from the drive.
Assignment 2: Quality control and normalisation of the microarray data set using ArrayAnalysis.org.
The raw microarray data (Affymetrix CEL files) will be analysed using ArrayAnalysis.org. A complete description of the workflow can be found under documentation. Please have a look at this to get a better idea of how the workflow works. At ArrayAnalysis under Quick Links on the left, click Affymetrix QC & pre-processing, bringing you to the screen below.
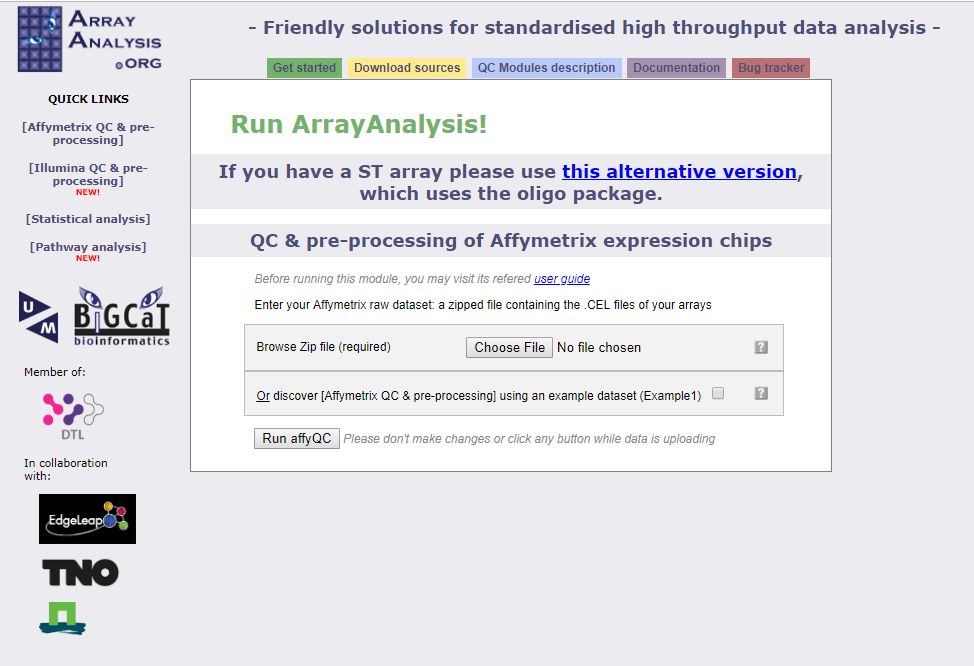
Click on “Choose File” and select the zip file of data titled GSE19804-samples10 and then click Run affyQC. The following screen will appear.
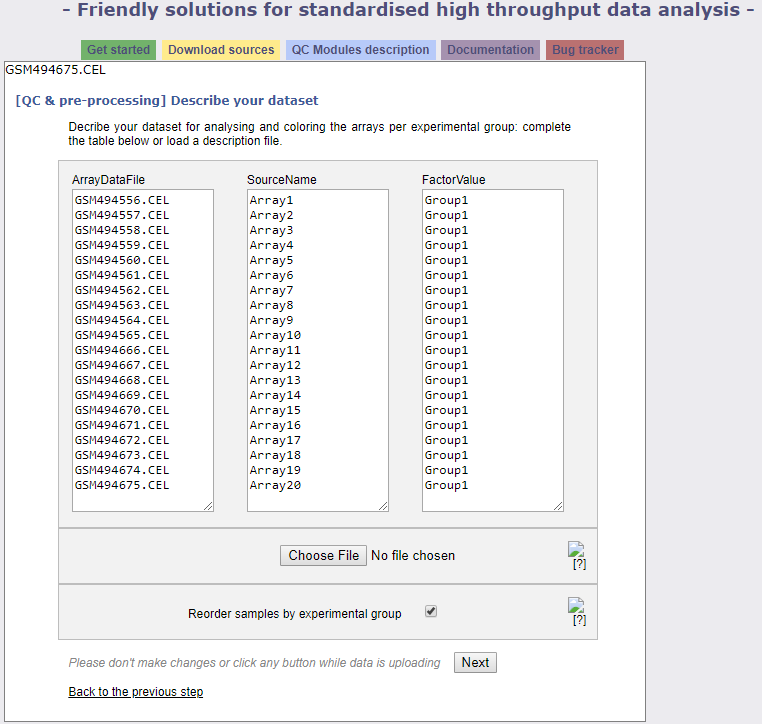
This is where you define the experimental groups. We have prepared a description.txt file (found in the drive) that you can upload with the Choose File button. Then click next which will bring you to the following screen.
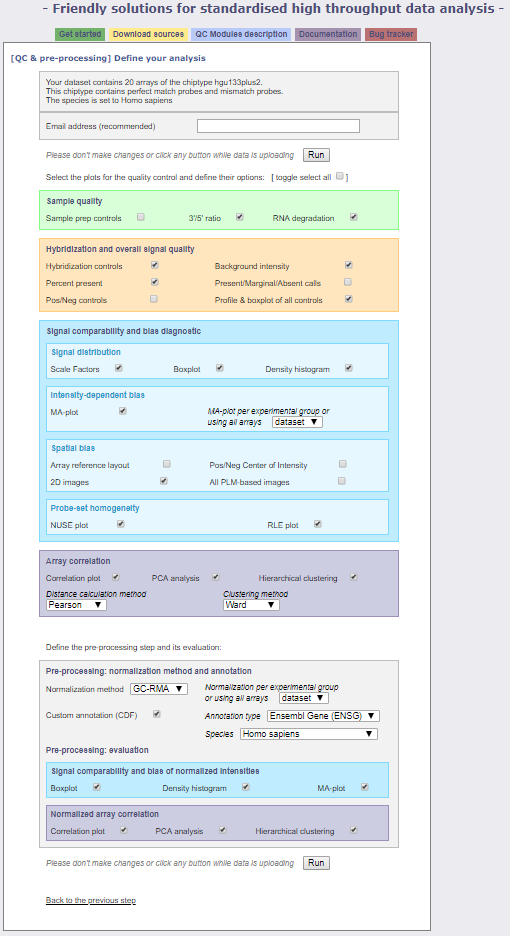
Fill in your email address and take a look at the different options. We will leave all but one of the default selections. Under the Pre-processing: normalization method and annotation section, change the normalization method from GC-RMA to RMA and click Run. This will take some time, but the pre-processing of your dataset is underway!
Answer the following questions related to the QC analysis:
If a question is not clear first check ArrayAnalysis.org. At the QC Modules description tab select the affyQC and scroll through all the plots present in your report!
Question 2A What is the quality of the housekeeping genes, beta-actin and GAPDH, in the arrays? Explain your answer.
Question 2B Is the background of all arrays ok? Explain your answer in detail.
Question 2C Explain in your own words what the percent present plots tell you.
Question 2D Based on the boxplots of raw intensities, are any arrays deviating?
Question 2E The report also contains MA. Since it is Affymetrix data we cannot compare the two channels for one array. Why not? Instead, ArrayAnalysis.org compares each array to the median of the data set (an artificial array that contains for each gene the median expression value present in the data set). Do the MA plots look fine?
Question 2F Interpret the cluster dendrogram and PCA plot.
Question 2G Interpret the cluster dendrogram and PCA plot after the normalisation.
Question 2H Would you remove any arrays from the data set based on the QC results and why?
Question 2I Normally, when it is required to remove low quality arrays, one would rerun the analysis after removing those. Why (think of two reasons)?
Assignment 3: Statistical analysis of the data set using ArrayAnalysis.org.
In addition to the quality control and normalisation, ArrayAnalysis.org can statistically analyse gene expression between different groups. The normalised data obtained after running the quality control in ArrayAnalysis.org is used as an input for the statistical analysis. After your normalisation is complete, ArrayAnalysis will bring you to the following screen.
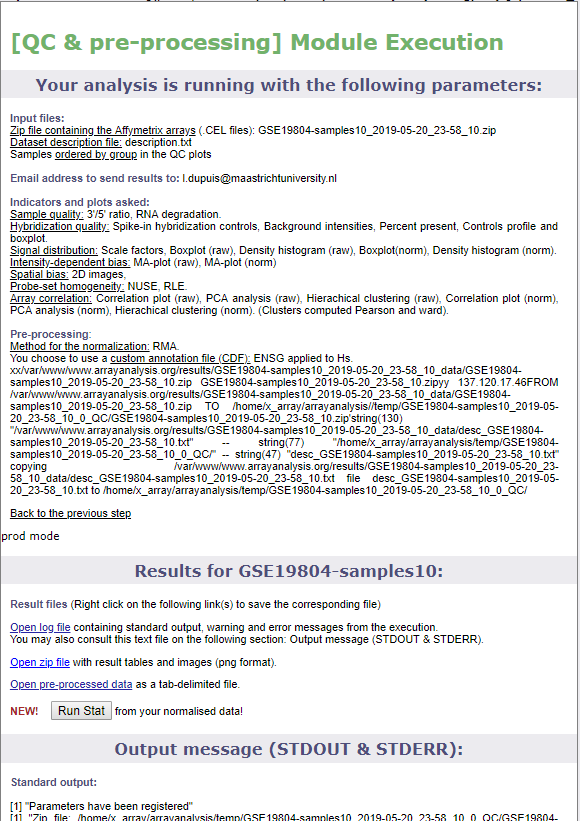
Your normalization has been completed successfully, and you can continue to the statistical analysis by clicking Run Stat under the Results. It will bring you to the following screen where the groups are defined. Click Next. This will bring you to a screen with statistical analysis options. We can leave the defaults, enter your email address, and click Run. Then your statistical analysis will begin.
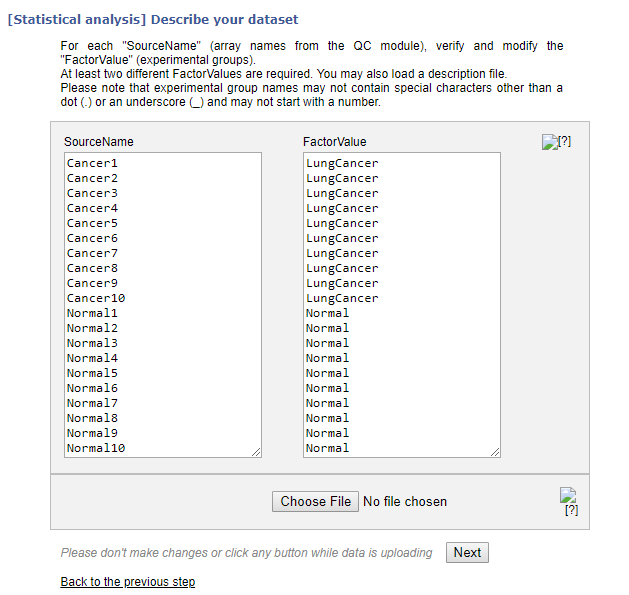
Statistical analysis has been performed to compare the two groups of the dataset (Lung cancer versus normal).
Have a look at the results and answer the following questions:
Question 3A What can you tell from the p-value histograms and summary table (open the latter in Excel)?
Question 3B What can you tell from the FC plot? Note: the FC here is an adapted FC, for ratios between 0 and 1 – so down regulation – the value is replaced by a minus sign and the corresponding up regulated value. So instead of ½ the value gets -2, interpreted as ‘a 2 fold down regulation’. This procedure also means that values between -1 and +1 cannot exist.
Question 3C Open the file ‘comp_LungCancer-Normal_chosen_cutOff.txt’ in Excel. What do all columns in this file represent (ignore the ‘B’ value)? Note: if the computers have Dutch regional settings, open Excel first, go to the ‘open’ menu, click ‘next, click ‘next’, and then click the ‘advanced…’ button and swap the dot and the comma, then click ‘finish’. Your data now opens correctly.
Question 3D The t-test used is an adapted t-test, not the standard ones (details are not relevant for now). If you would do the t-test yourself using Excel, which options would you choose? Paired or not paired? One or two sided?
Question 3E The adjusted p value is computed using the Benjamini Hochberg (BH) method, a less strict method than the Bonferroni correction (details not relevant). Why is the p value adjusted? How many genes would be significant after Bonferroni correction (at 0.05 level)? Is this useful? How many are significant after BH correction?
Question 3F Apart from cut offs on the p value and fold change, also a cut-off may be used on the average intensity (expression) of a gene. Why could it be useful to use a cut-off on the average expression (hint: every technology has a noise level)?
Question 3G Look at the most significant genes, for each of the tables. Do the findings make sense with respect to the topic of the study? Are the findings similar between the comparisons?
Of course, in reality, you would not only look at the top changed genes, but use more of the results in more dedicated and extensive analyses, such as clustering and classification, pathway and Gene Ontology analysis, and network analysis. These you will study in the next sessions.