 View on GitHub
Network Analysis
Using network analysis to study the molecular and regulatory mechanisms involved in RETT Syndrome
===============================================================================
November 27, 2019
Practical prepared by: Dr. Martina Summer-Kutmon and Dr. Lauren Dupuis
In this part, we want to show you different ways of how you can build biological network relevant for a biological research topic. Cytoscape has a lot more functionality and you are free to explore other apps in the project if you want to.
The data used for the tutorials is from the study of Lin et al. 2016, and the pre-processed dataset we will use for analysis can be downloaded here.
Part 1: Import the Microglia Pathogen Phagocytosis pathway in Cytoscape
Before beginning, make sure the WikiPathways App is installed. Click “Apps” - “App Manager”. Search for WikiPathways and click “Install”. Do the same for “stringApp”.
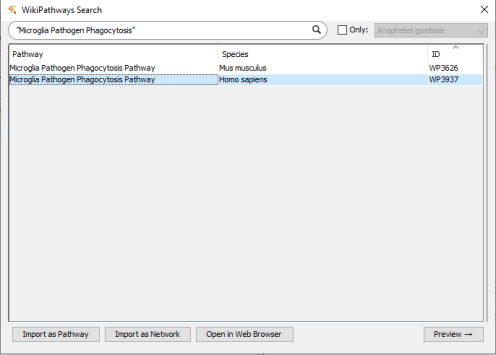
Now we can begin by importing the Microglia Pathogen Phagocytosis Pathway as a network. • Go to “File - Import - Network From Public Databases” • A dialog box will appear. Change the Data Source dropdown box to “WikiPathways”. Search for “Microglia Pathogen Phagocytosis”. Click the check box for “Only:”, and choose “Homo sapiens” in the dropdown box. • Select “Microglia Pathogen Phagocytosis” from the list and click “Import as Network”
• You should now see a network with 63 nodes and 68 edges.
Question 1A Are all nodes connected or do you see subnetworks or unconnected nodes? Make a screenshot.
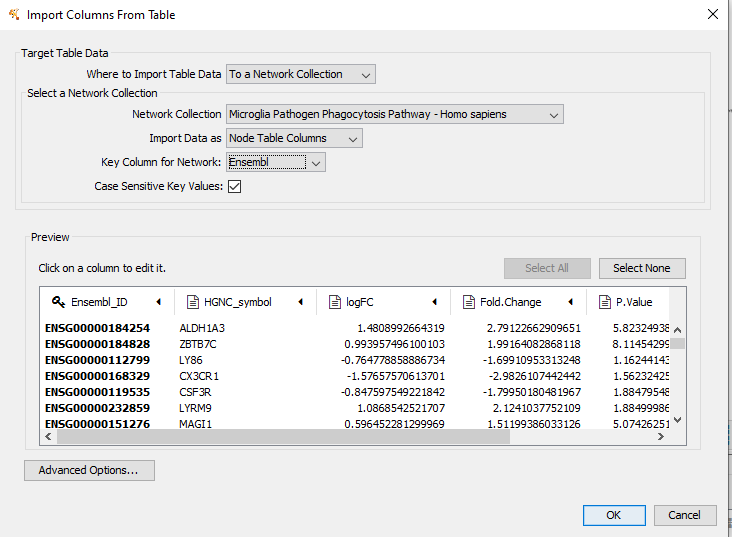
We can import the expression data to visualize on the network. Click the “Import Table from File” Icon and import the dataset.
![]()
This will open a popup window shown below. Make sure you change the key column to Ensembl.
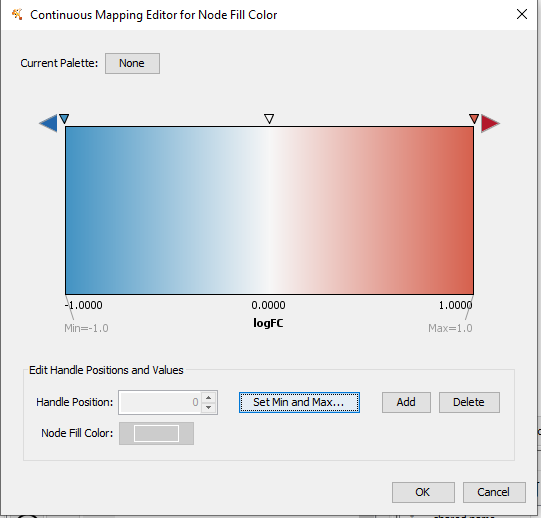
You can change the visualization by clicking the “style” tab. Visualize the logFC on the nodes by clicking on the Fill Color. Change the Column to logFC and the Mapping Type to Continuous Mapping.
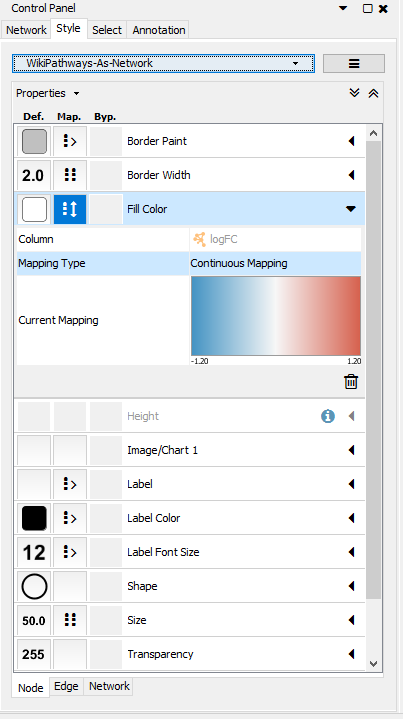
By double-clicking on the current mapping, you can open a popup window to change the limits of the gradient.Set the limit from -1 to 1.
Part 2: Build network for down-regulated RETT syndrome genes
Step 1: Gene selection
• Import the dataset (RETT_vs_control_FC_filtered.txt) in Excel. • Select the significantly down-regulated genes with a log2FC < -0.58 → filter the table by log2FC (<-0.58) and the P.Value (< 0.05). • Copy the Ensembl IDs of the 133 genes.
Step 2: Create PPI network for gene selection
• In Cytoscape, go to the Control Panel and select the STRING protein query (drop-down box left to search field) and paste the 133 gene names in the query field
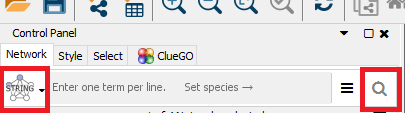
• Click on the search icon. • Cytoscape will create a network with 128 nodes and 172 edges
Question A Are all nodes connected or do you see subnetworks or unconnected nodes?
• Select the largest connected subnetwork (click shift and select the area of the subnetwork with the computer mouse). Go to File - New Network - From selected nodes, all edges. • A new network will be created only containing the largest connected subnetwork with 71 nodes and 161 edges.
Step 2: Investigate the network properties of the network
• Go to “Tools → Network Analyzer → Network Analysis → Analyze Network…” o The network should be treated as an undirected network (protein-protein interactions, in general, do not have a direction) • This tool will calculate all network properties such as degree and betweenness for you.
Question B Look at the “Node degree” and “Node betweenness” tab in Results panel of the Network Analyzer. How are node degree and betweenness distributed in this network? Do the distributions make sense? Are there any interesting observations?
Step 3: Create visualization to show disease score and degree
• In the NetworkAnalyzer result dialog, click on “Visualize Parameters”. Select the node degree as node color gradient (Map node color to → Select “Degree”) and the node betweenness as node size.
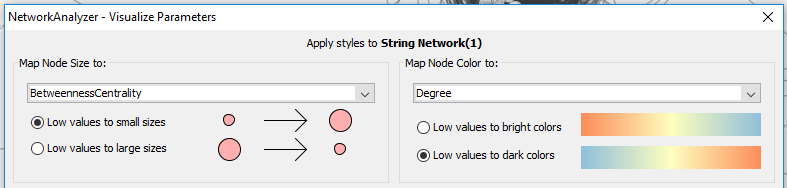
Question D Describe the overall network visualization. Large nodes have a high betweenness and the redder the node, the higher the degree.
Question E Can you find any hub nodes? (Hint: columns in Cytoscape are sortable by clicking on the header) TYROBP has highest degree.
Part 3: Find more information about hub gene
There is one gene, TYROBP, with a higher degree. The human protein atlas is an exceptional resource to find out more information about the expression of a gene/protein in different tissues but it also provides detailed pathology analysis for relevant genes. • Go to the protein atlas • Search for TYROBP • You can look around for information regarding this gene. Do you think it would be relevant for RETT syndrome even though it’s not listed as such?